
Stock Trading Signals Today for Tomorrow's Trades
Freedom analyzes the trading patterns of every U.S. stock that trades daily on the NYSE & NASDAQ stock exchanges after the markets are completely closed and generates a new trade signal for tomorrow's trading for more than 11,000-plus stocks and ETFs.
Trade signals so profitable that Freedom's model portfolio is significantly outperforming all the major U.S.Index benchmarks - finishing up +18.86% in April and is up +46.47% YTD
In the same time period the index benchmarks were all way, way behind:
- The DJ-30 was down -3.20% in April, and is down - 4.41% YTD
- The S&P 500 was down -0.80% in April, and is down -5.31% YTD
- While the NASDAQ COMP was up + 0.90% in April, but is down - 9.65% YTD
Each evening, after the markets are completely closed, Freedom's exclusive AI tools and proprietary trading algorithms generate new trade signals for tomorrow...
You get tomorrow's trade signals today - by 8:00 PM EST each evening. Signals based only on your stock's actual historical daily price and volume data over the last 2 years from the U.S. exchanges...
Freedom uses technical analysis and quantitative analytics
to uncover each stock's past trading patterns.
Trading patterns that have been enormously profitable when they're repeated in the future and have regularly generated weekly and monthly profits greater than 100%.
You pick your stock, enter its ticker symbol in the "User Inputs" box, and press the "Analyze" button - the only button on the screen - and you get your stock's next-day trade signal for tomorrow in just seconds.
Freedom really is this simple!
Start your 14-day free trial today - and be trading tomorrow!
What Is Freedom?
Watch Our Two-Minute Animated "What Is Freedom?" Video
And check out our YouTube Channel to see our "What Is Freedom?", "How To Freedom", and "Freedom Quickies" videos - to see what Freedom is, how it works,
and, how Freedom was up +18.86% in April, and how it's up +46.47% YTD
Freedom really is this simple!
Freedom Subscriptions
Flexible Packages - All Starting With A 2-Week Free Trial
No Lockups & No Hassles
Freedom Features
Profitable, Powerful, Simple
Take Freedom
for a totally free 2-week test drive with any subscription package and analyze any one of the 11,000+ stocks that trades daily on the NYSE or NASDAQ stock exchanges and see their next-day trade signals for tomorrow!
Trade signals so profitable that Freedom's model portfolio has totally outperformed the major U.S. index benchmarks throughout 2025:
up +18.86% in May - up +54.84% year to date

Start Your "No Limits" 2-Week Free Trial Now
Freedom's Proprietary Trading Algorithms
"No Limits" because during your trial period you’ll have access to every proprietary analytics tool - and all of their proprietary trade metrics that you’ll have as a paid subscriber.
Especially tomorrow’s trade signals today - for all 11,000 stocks that trade daily on the main U.S. exchanges.
Simply Great Results: May - Up +18.86% - Jan - May: Up +54.84%
Freedom's trade signals are also incredibly profitable. Our model portfolio's total results for the first five months of 2025 produced:
- A total portfolio gain of +54.84% between January & May
- A best monthly gain of +18.86% in April
- A best monthly single stock gain of +22.73% in April
- A worst monthly single stock loss of -4.50% in March
11,000 U.S. Stocks - 1 Button
Experience the power of
Freedom's
professional trading tools and analytics and analyze any stock
that trades daily on the NYSE or NASDAQ stock exchanges.
With the click of a single button. In fact, it’s the only thing you can do —
because it's the only button on the screen:

The StockAnalyzer's "Analyze" button -
the only button on your screen
Five Easy Pieces of Information
Every time you open
Freedom you'll start on the main "StockAnalyzer" page:
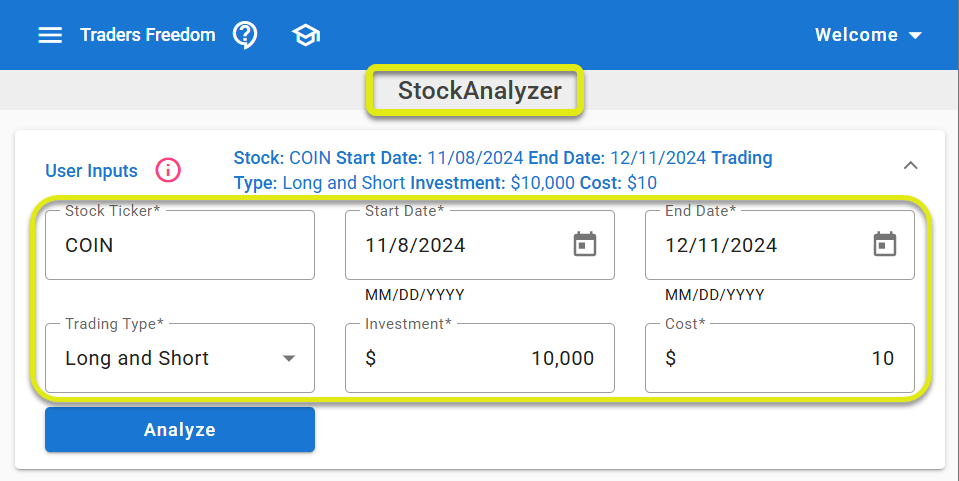
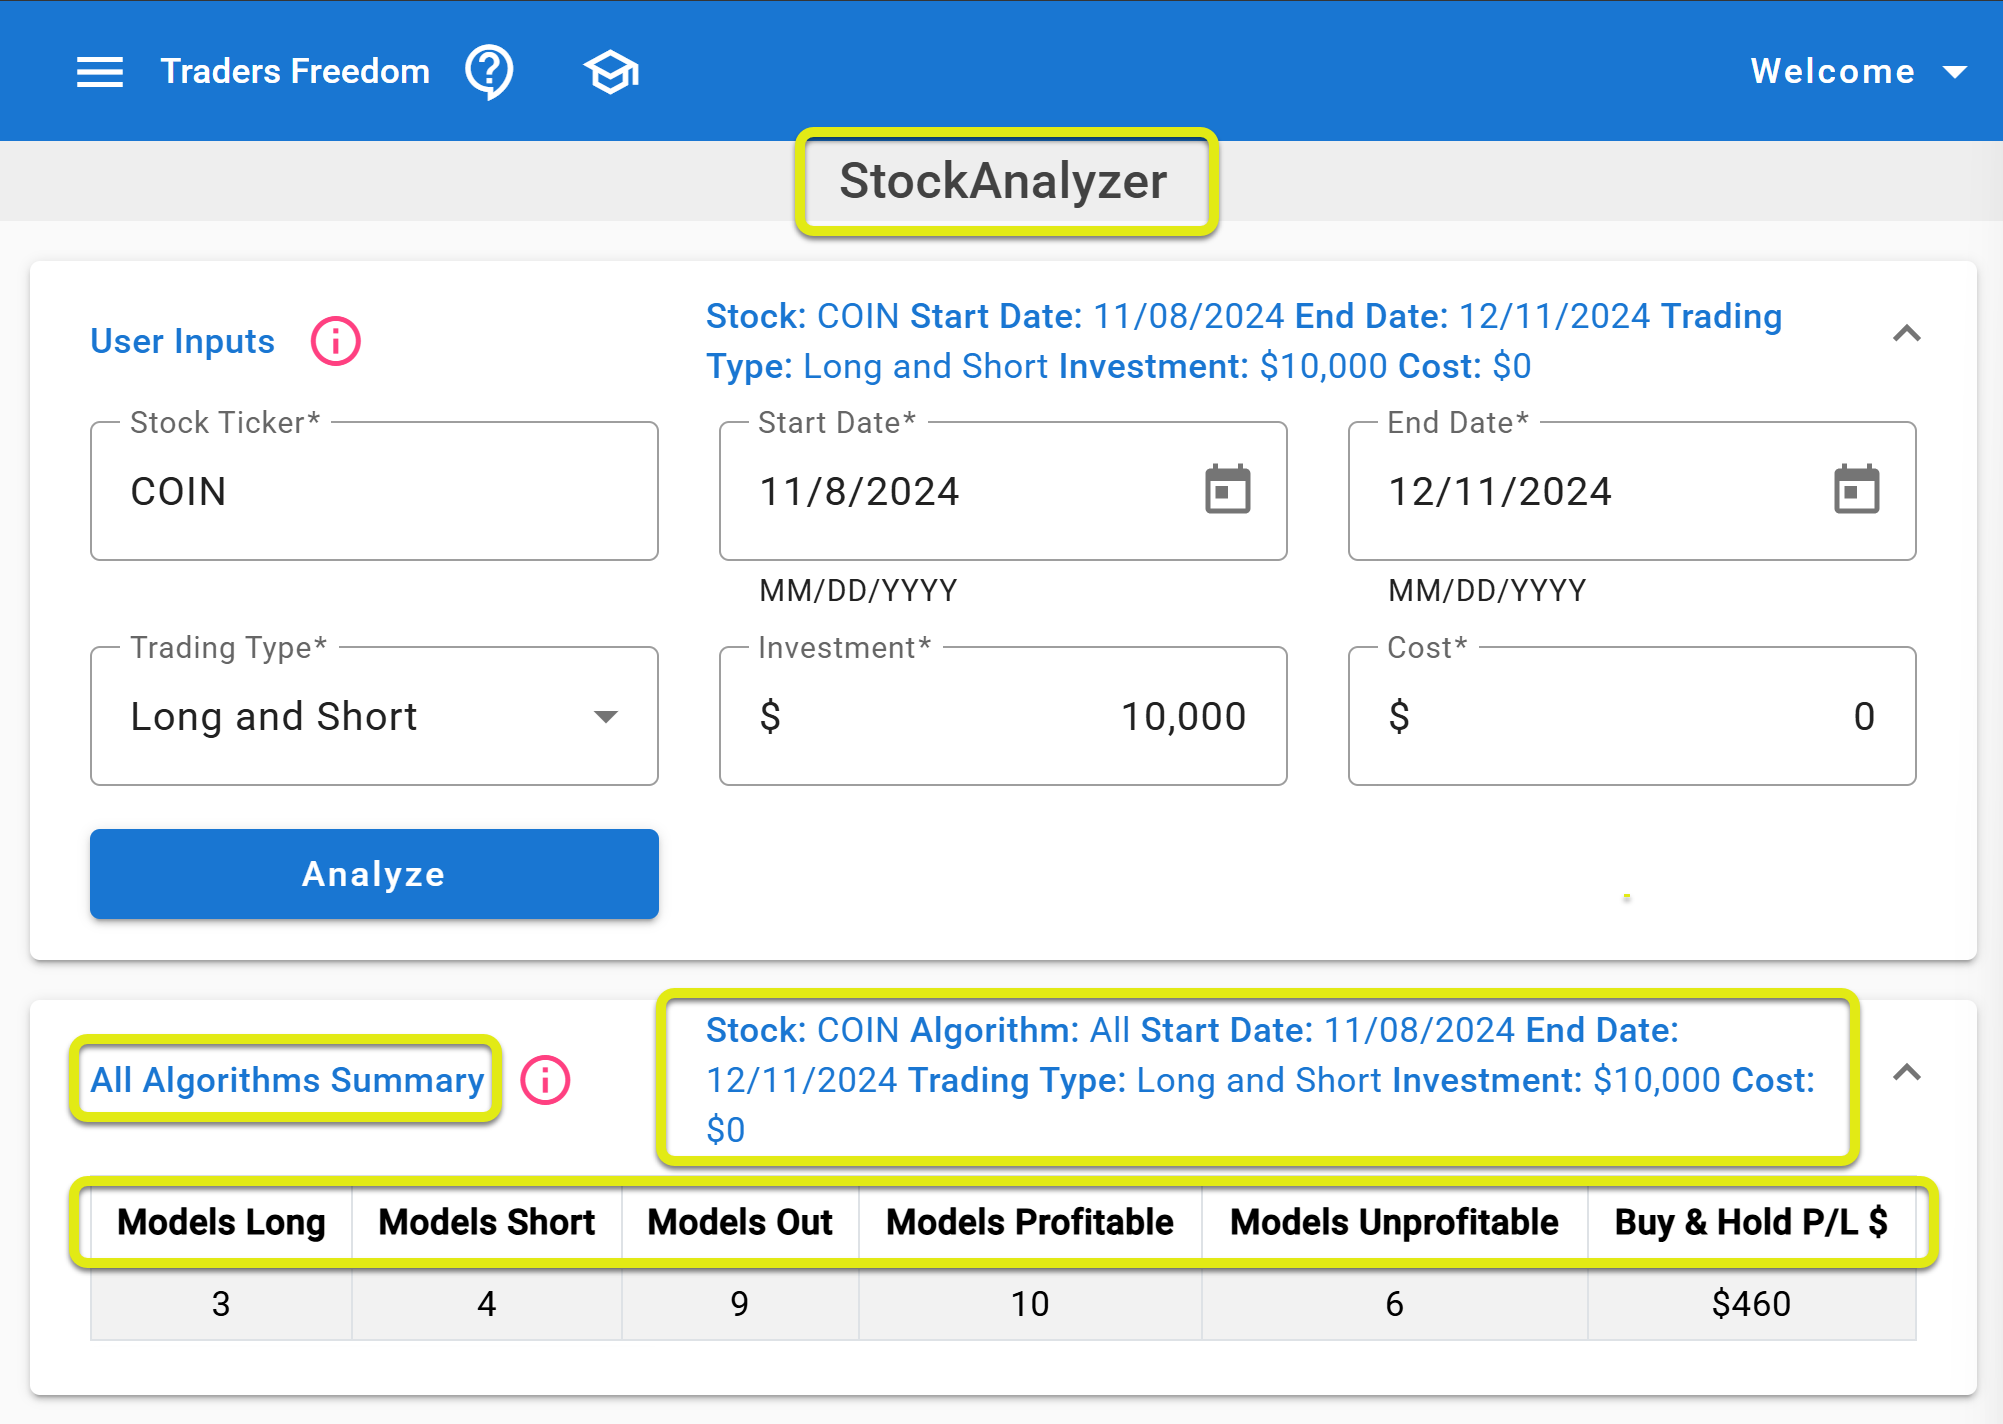
The StockAnalyzer "User Inputs" box –
just five fields to fill in
At the top of the page you'll see the "User Inputs" box. Inside it are five simple user input fields — the only details you'll
ever need to enter on the main "StockAnalyzer" page to analyze any stock.
- The “Stock Ticker” of the stock you want to analyze
- The “Start Date” you want to begin your analysis on
- The “End Date” you want to end your analysis on
- The “Investment Amount” you're comfortable trading with
- The “Cost Amount” if your trades are commision-free - just enter $0
The StockAnalyzer "User Inputs" box –
just one button to push
After you've completed filling in the "User Inputs" fields, all that's left to do is press that big, blue “Analyze” button - the only button on the screen.
And the summary results from pairing the stock you picked with all 16
Freedom algorithms will be displayed almost immediately - in the "All Algorithms Summary" box - right beneath the "User Inputs box you just finished reviewing.
Your Stock + 16 Freedom Algorithms
And all its proprietary data is delivered to you in just seconds - as soon as you press that "Analyze" button:
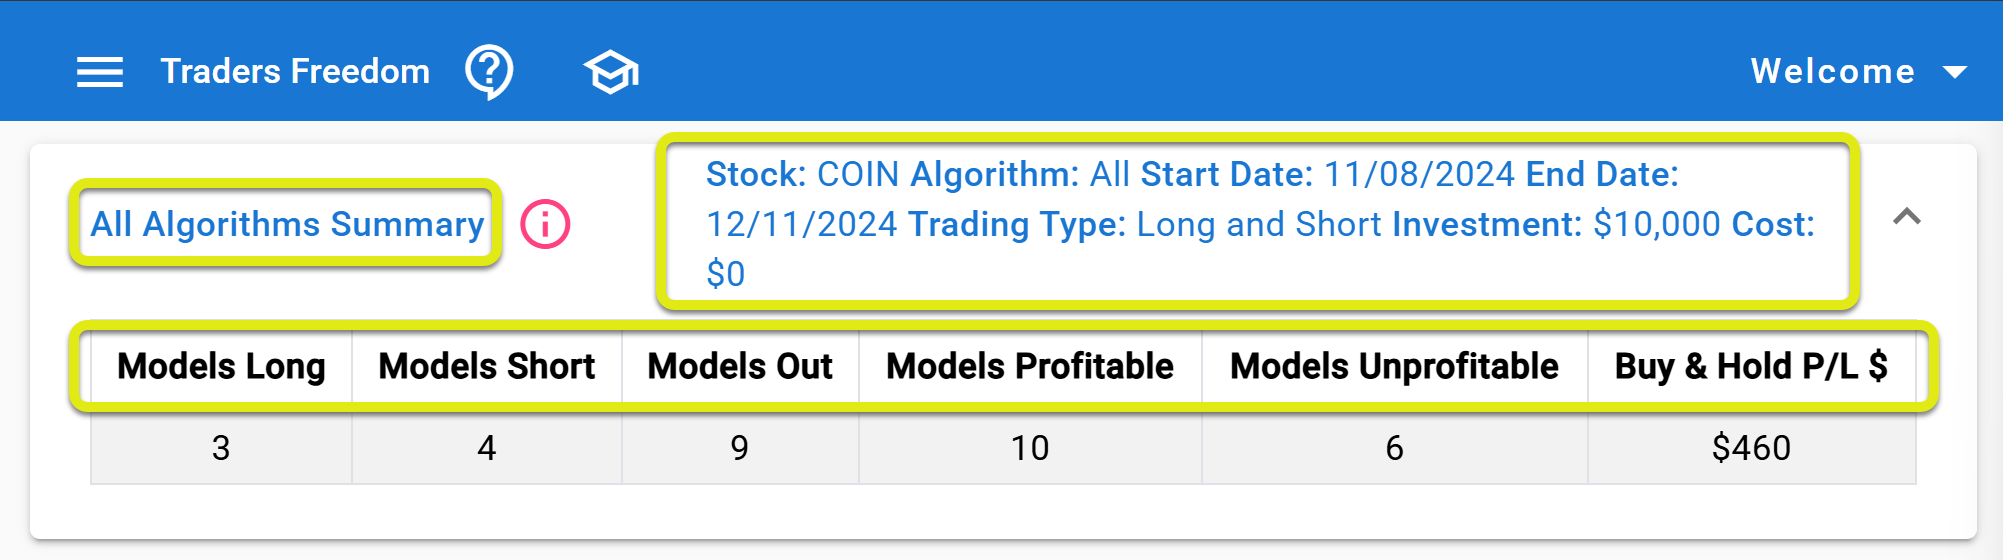
The StockAnalyzer's "All Algorithms Summary" box - –
your stock paired with all 16 Freedom algorithms
- How many of your stock's 16 trading models have trade signals for tomorrow that are Long, Short, or Out
- How many of it's 16 models have been profitable or unprofitable during your analysis period
- What is your stock's "Buy & Hold P/L $" - or if you'd just bought your stock on your "Start Date" and held it right through your "End Date"
The obvious first question you'd want an answer to is "How many of my stock's models made money?" In our example above, 10 algorithms made money while 6 algorithms lost money. So in this example, since the majority of models made money we decided to continue analyzing our stock and digging deeper into it's proprietary trade details.
But with a question like, "How many models were profitable?", only you can decide how many models is "enough" for you to continue analyzing that first stock you picked? Then, if you decide to dig deeper into its proprietary trading results to discover your stock's "best" model and find its "best" model - whats it's trade signal for tomorrow?
With each stock you analyze you'll follow the exact same process. And each time you'll need to decide:
- Have you found your stock's "best" model?
- Or do you need to dig more into your stock's other models as well?
- Or do you need to pick a different stock altogether and find its "best" model?
- Or, do you need to compare your "best" Stock A and "best" Stock B models to find the "best of the best"?
- Or, would you want to see more choices to find your "best" trading opportunity - so you'd want to look at Stock #2 & Stock #3?
But then, when you do find what you think is your stock's "best" model, and your best trading opportunity for tomorrow, it couldn't be simpler to move on to the next step in your analysis.
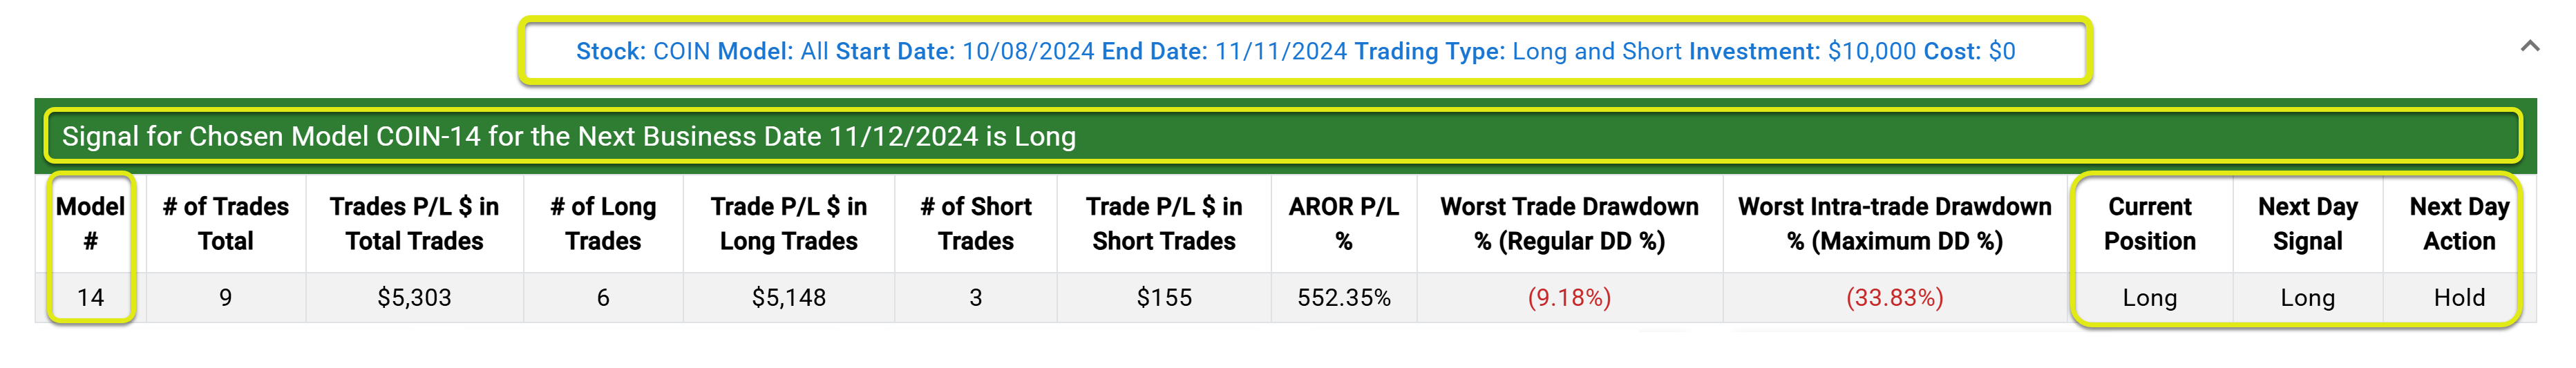
Because Freedom's second-level metrics are already right there on your your screen - in the "All Models Summary" table - right beneath the "All Algorithms Summary" box that you just began your analysis with.
Your Stock + 16 Freedom Algorithms = 16 Freedom Models
The StockAnalyzer's "All Models Summary" table displays all of Freedom's level-2 trade summarized details and metrics for each one of your stock's 16 trading models during the time period you chose. Including each model's $ and % P/L, # of trades, trade dates, and trade prices.
And most importantly - each model's proprietary trade signal for tomorrow:
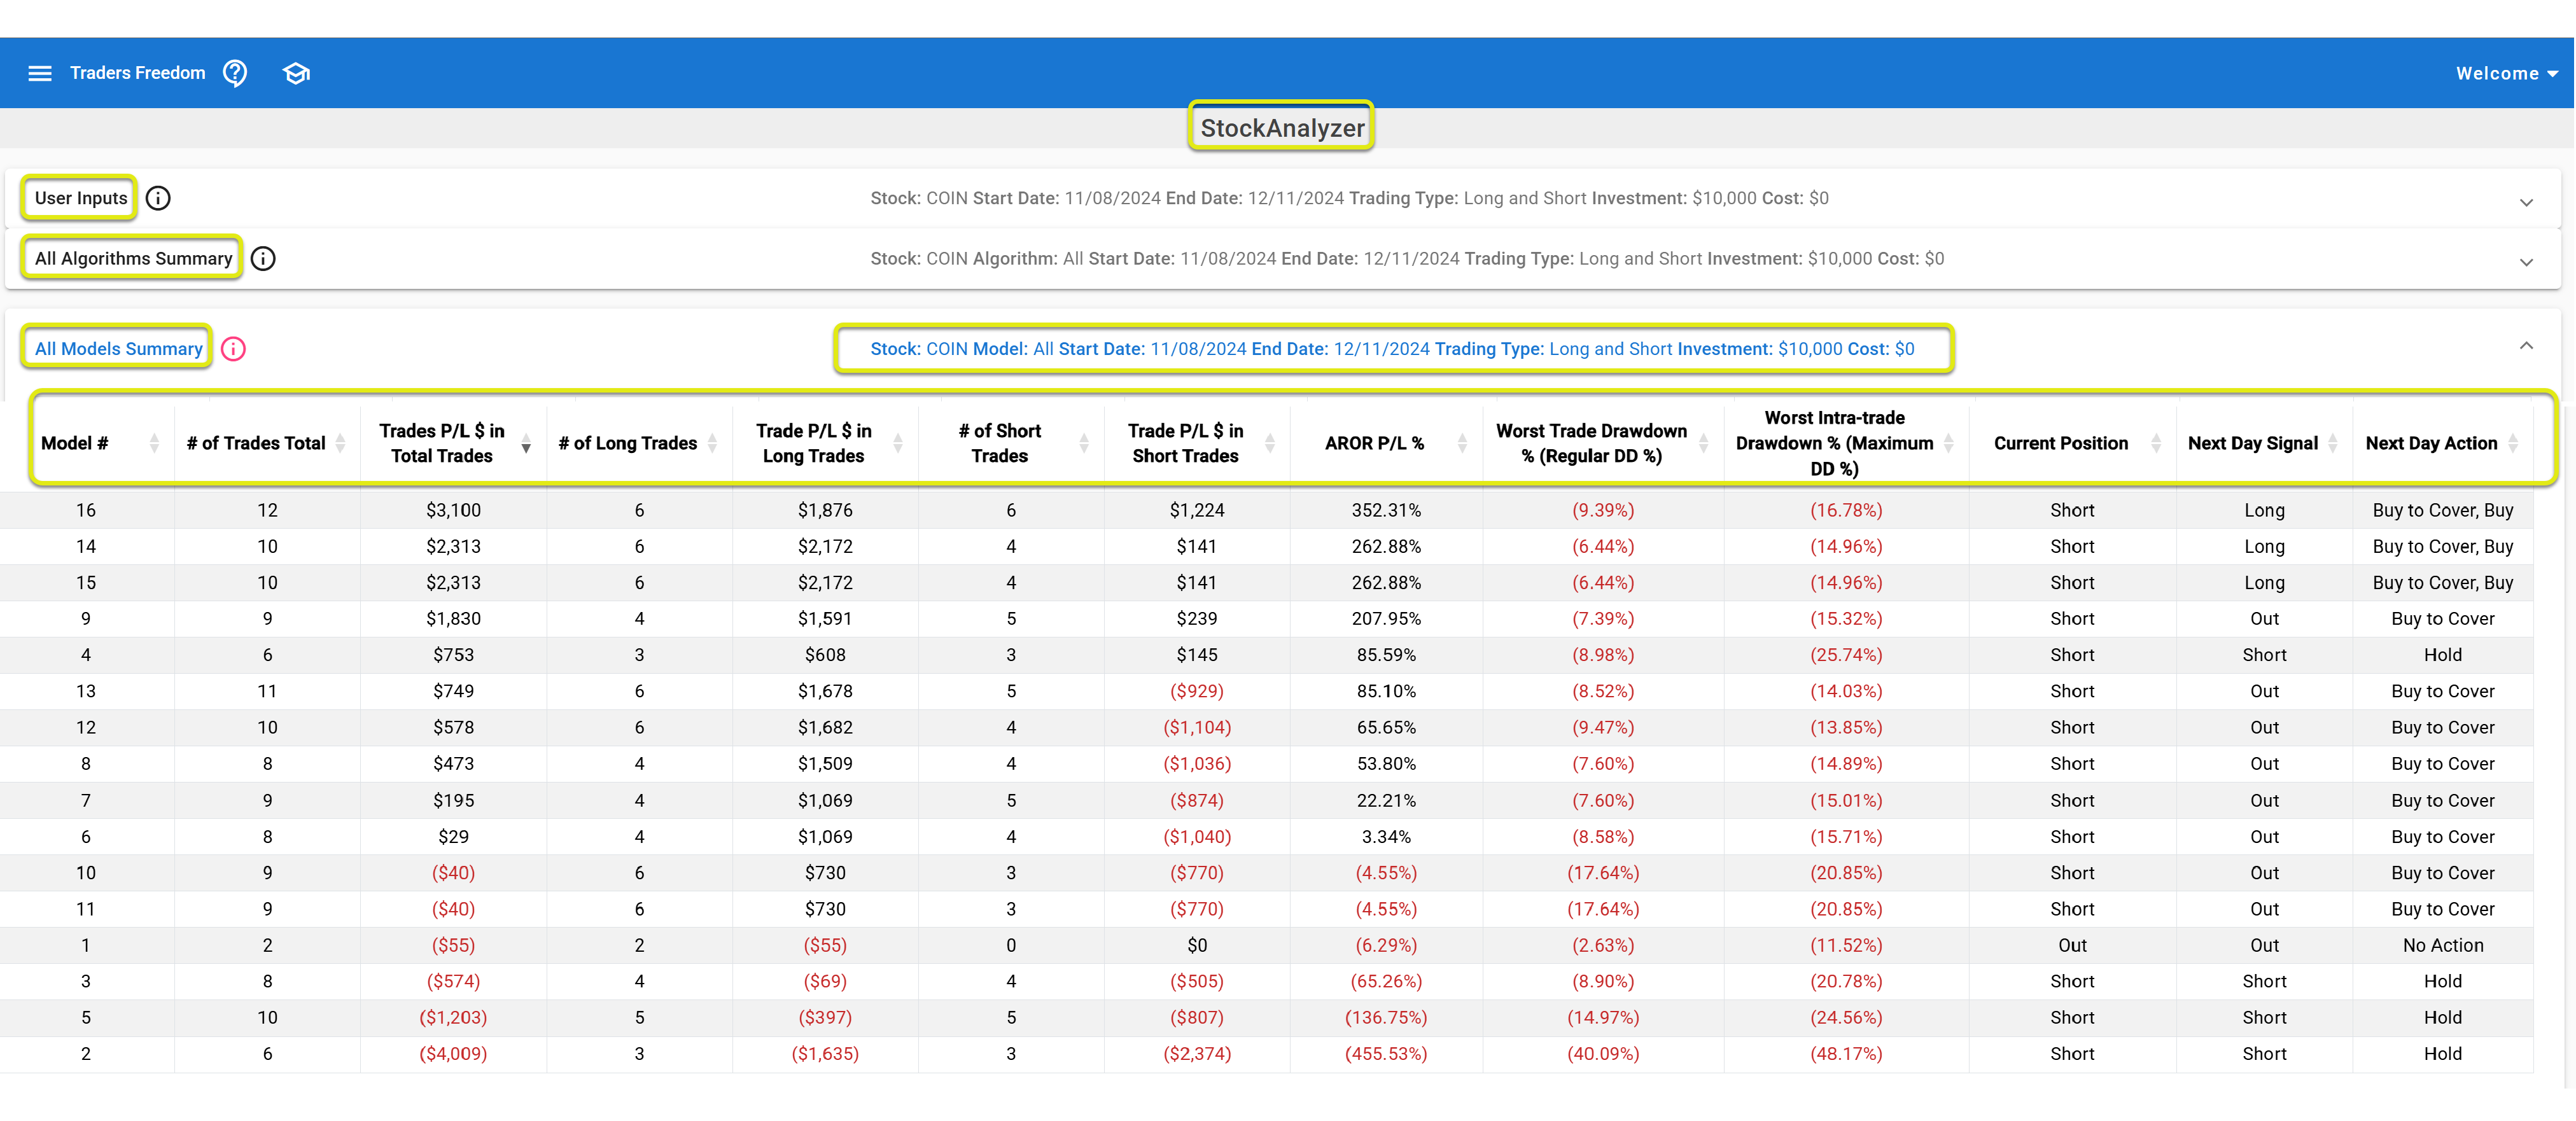
The StockAnalyzer's "All Models Summary" table -
each Freedom model's summarized results based on your stock
At this point in your analysis, your next task is review the more detailed level-2 metrics you see in the "All Models Summary" table to narrow down the finalists for your stock's "best" model.
Or, move on, pick a different stock - and look for something better.
Freedom really is this simple


Freedom's Proprietary Trading Algorithms
Freedom's Proprietary Trading Algorithms
Your first step is to check your stock's first-level summarized algorithmic trade results in the "All Algorithms Summary" box:
Then, if you like it's summary metrics, your next step is toreview the more detailed trade results and details you'll find in the "All Models Summary" table - which displays the specific trade metrics Freedom's proprietary algorithms were able to produce when paired with your stock to create your stock's specific models.
Freedom's Proprietary Trading Models
The "All Models Summary" table contains Freedom's more detailed, second-level trade metrics for all 16 of your stock’s trading models:
In the "All Models Summary" table you'll see 16 rows of data - one row for each model #. Each row displays that specific model's much more specific second-level trade results and details. Clearly laying out how profitably you could have traded the stock you picked just by following your stock's models' proprietary daily trade signals.
Each row in the table displays each model's next-day trade signal, plus a collection of advanced trade details and metrics that produced that model's latest trade signal. Signals based solely on your stock's historical price, volume, and trading patterns, including:
- The # of trades made by each model during your analysis period
- Various types of trade profit/loss results accomplished by each model
- The single trade worst loss risk levels each model reached during your analysis period
- The # of trades made by each model during your analysis period
- And, to simplify your next potential trade, it also includes your model's "Current Position", "Next Day Signal", and the "Next Day Action" you'd take the next trading day to stay in sync with that trading model
It should eventually take you less than a minute to review the summarized first-level results and metrics you see in the "All Algorithms Summary" box. Then, as you continue your analysis by examining the contents of the "All Models Summary" table, it should eventually take you just a few minutes to review all of it's more specific second-level results and metrics.
And once you've completed these first-level & second-level analysis steps trying to discover your stock's "best" trading model, when you think you might've found that "best" trading model, the next step in your analysis is to click anywhere in that "best" model's data row in the "All Models Summary" table.
Freedom's Proprietary Trading Signals
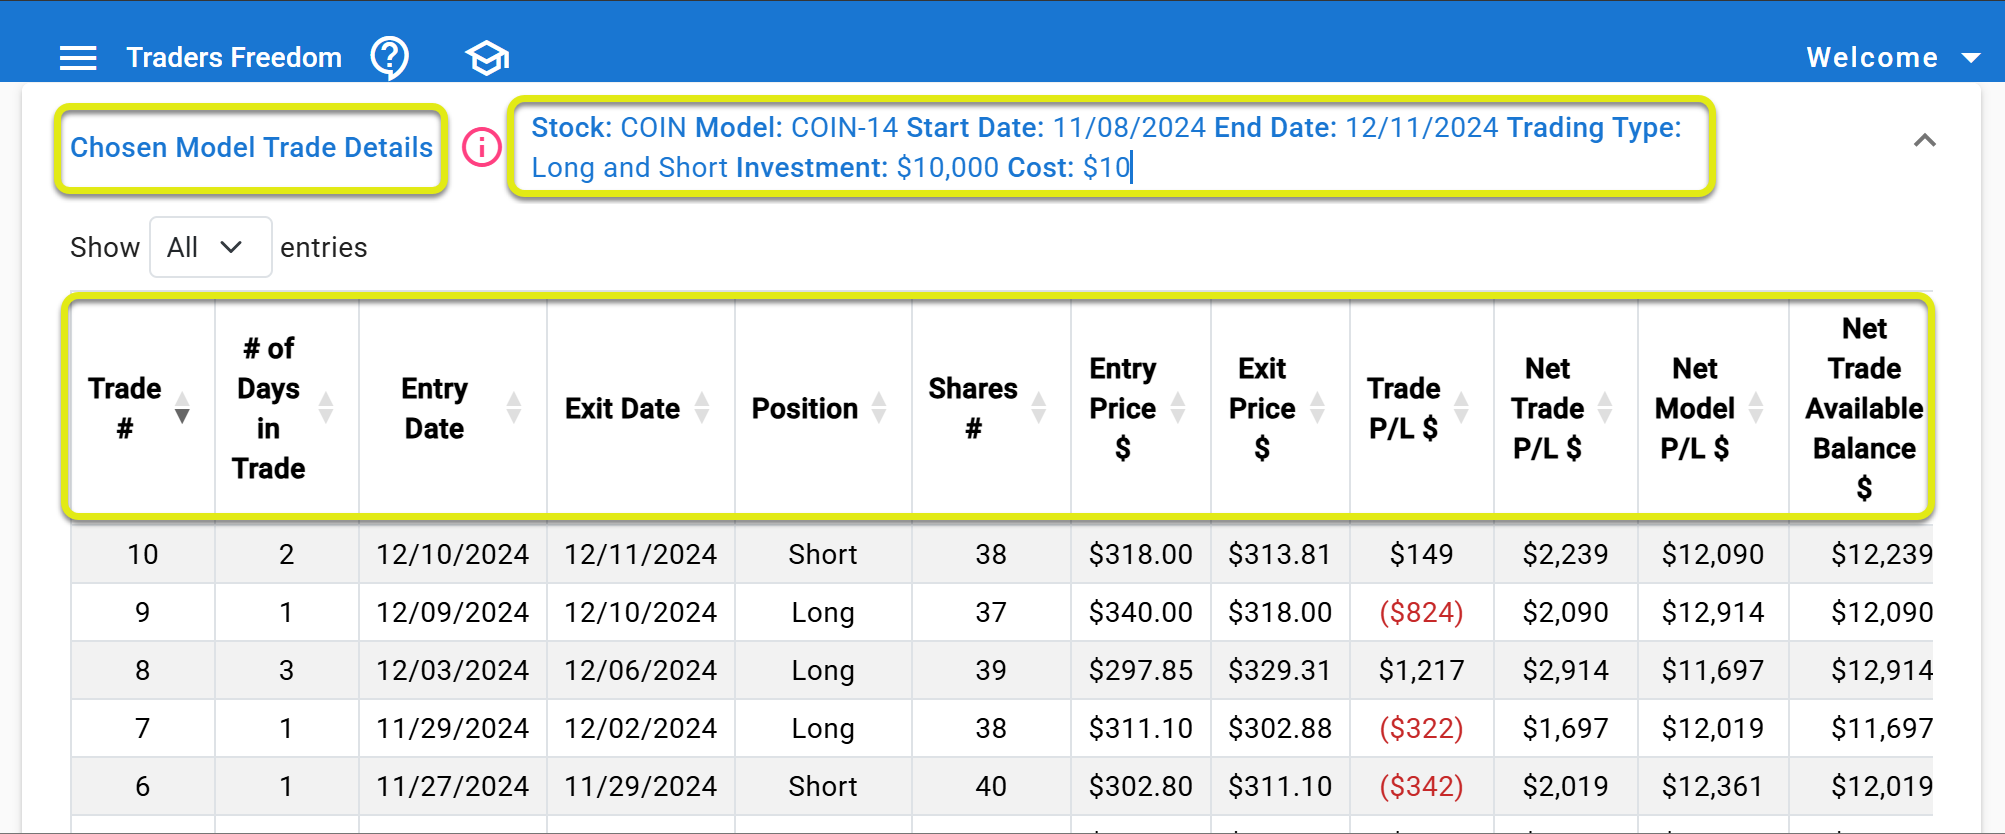
Clicking anywhere in any row of the "All Models Summary" table will launch Freedom's most critical, third-level analytics in the "Chosen Model Trade Details" table, and the "Chosen Model Next Day Trade Signal" bar:
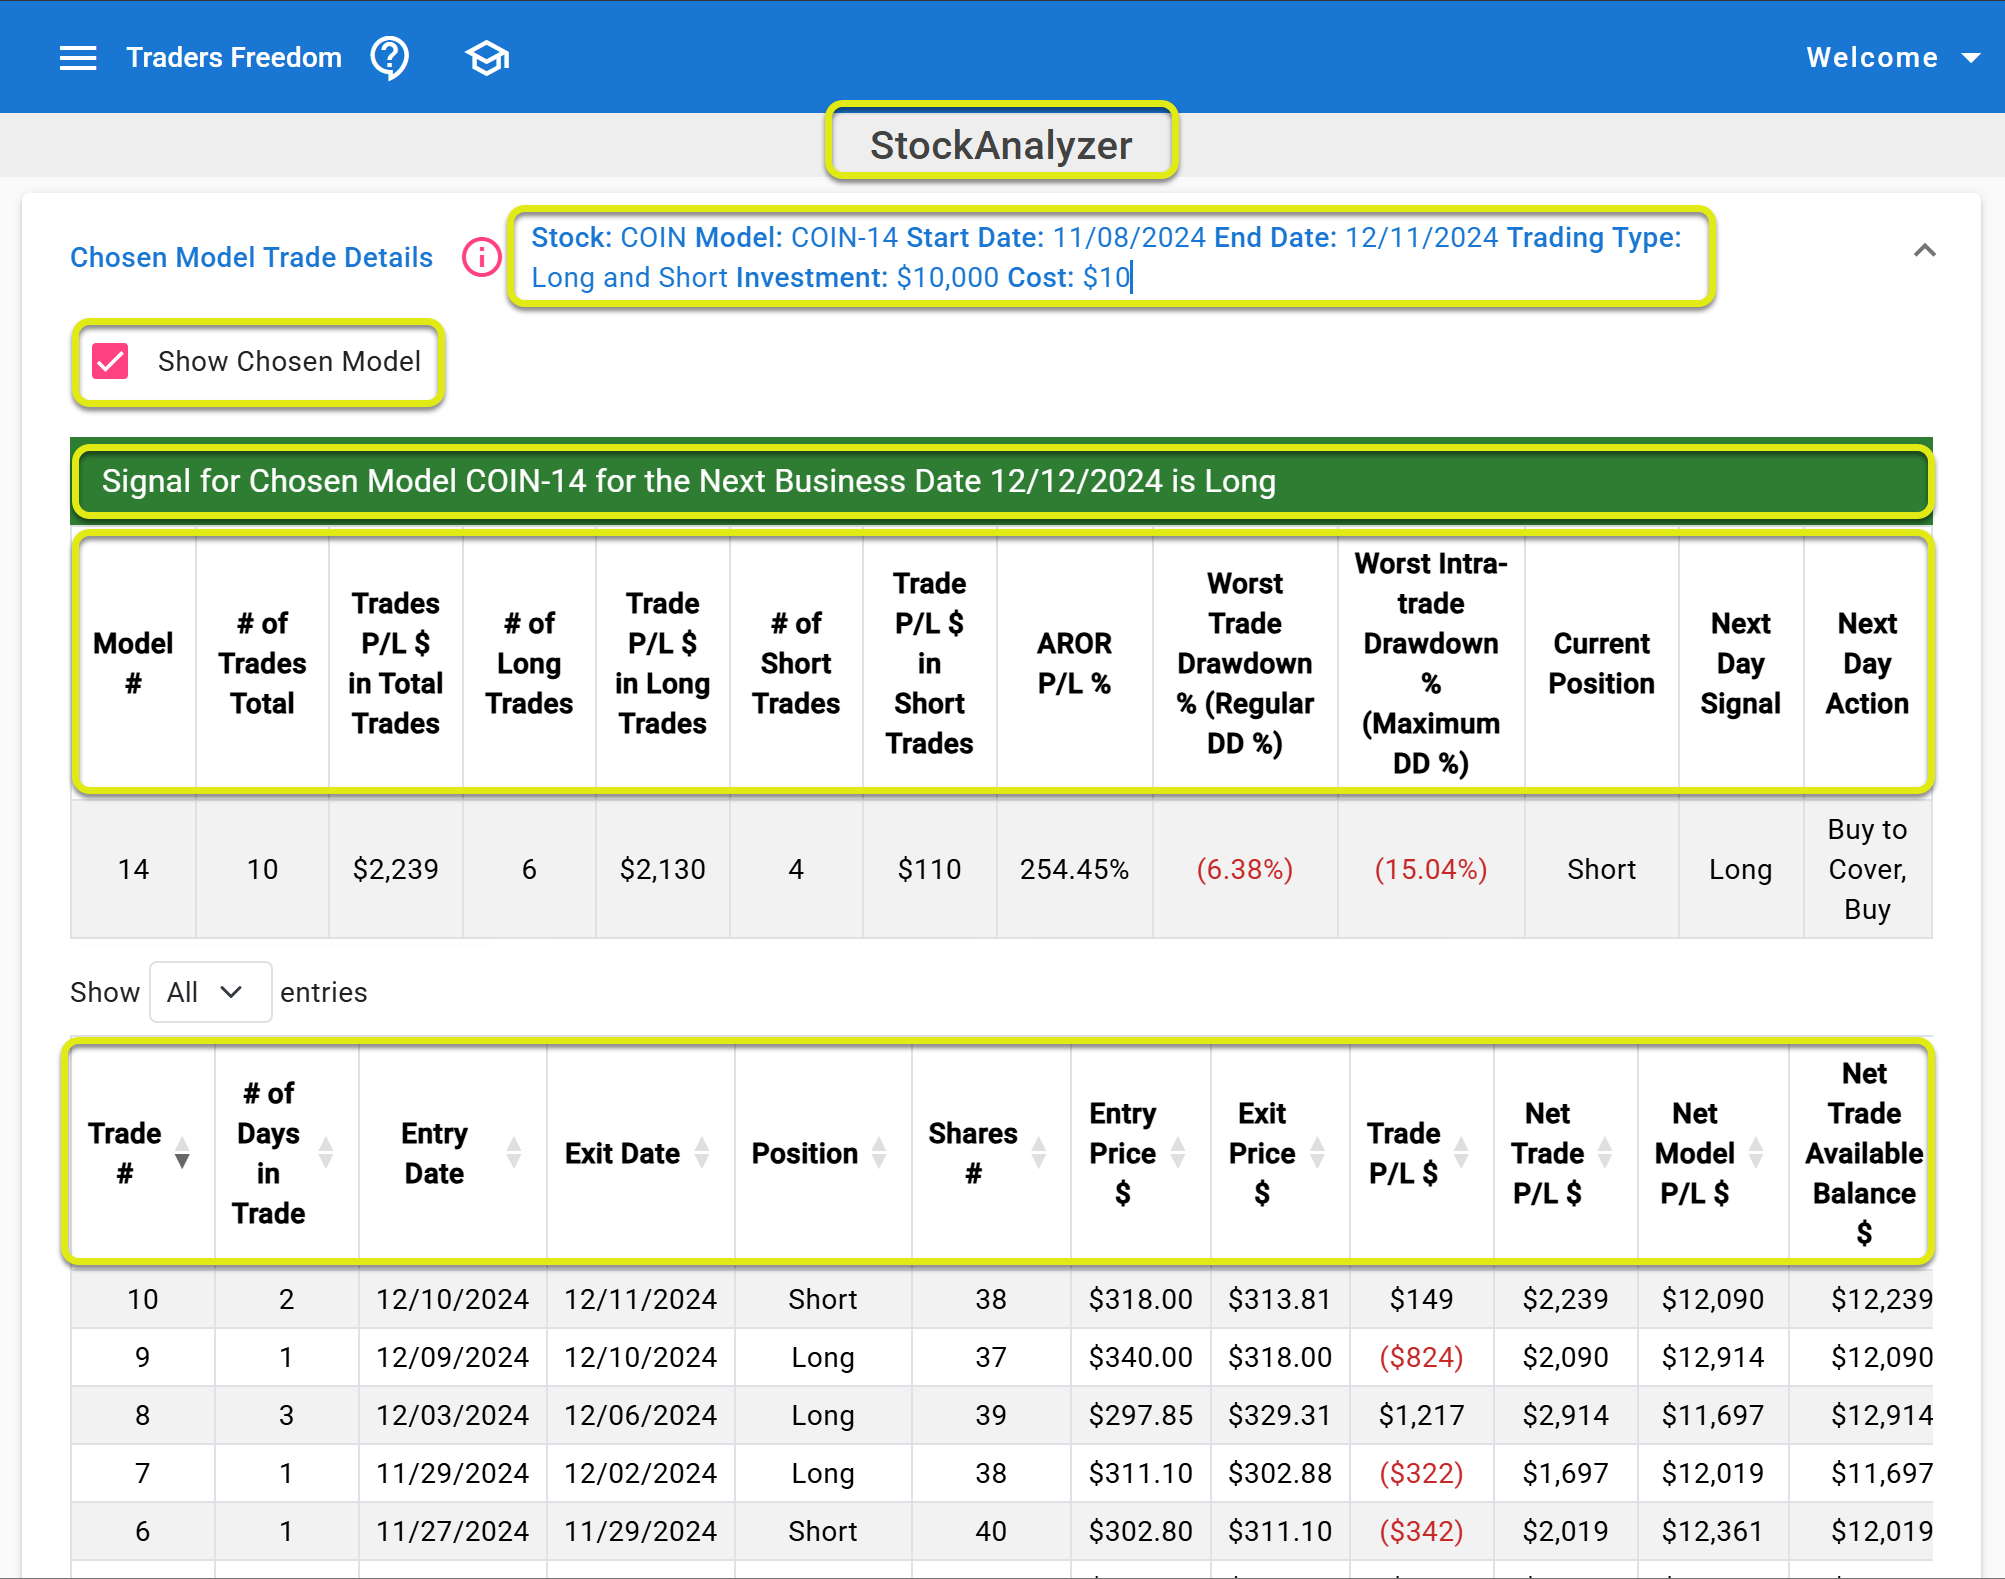
"The StockAnalyzer's "Chosen Model Trade Details" table
& "Chosen Model Next Day Trade Signal" bar -
Freedom's critical third-level analytics
In the "All Models Summary" table you saw 16 rows of data - one row for each algorithm/model #. And each row in the table contains that model's much more specific trade results and details - based solely on your stock's historical price, volume, and trading patterns.
The table's data clearly shows you how profitably you could have traded the stock you picked by following any of your stock's model's proprietary trade signals. With each row in the table displaying that corresponding Freedom models'next-day trade signal, plus a collection of additional advanced trade details and metrics like:
- The # of trades made by each model during your analysis period
- Various types of trade profit/loss results accomplished by each model
- The single trade worst loss risk levels each model reached during your analysis period
The StockAnalyzer's "Chosen Model Next Day Trade Signal" bar even includes:
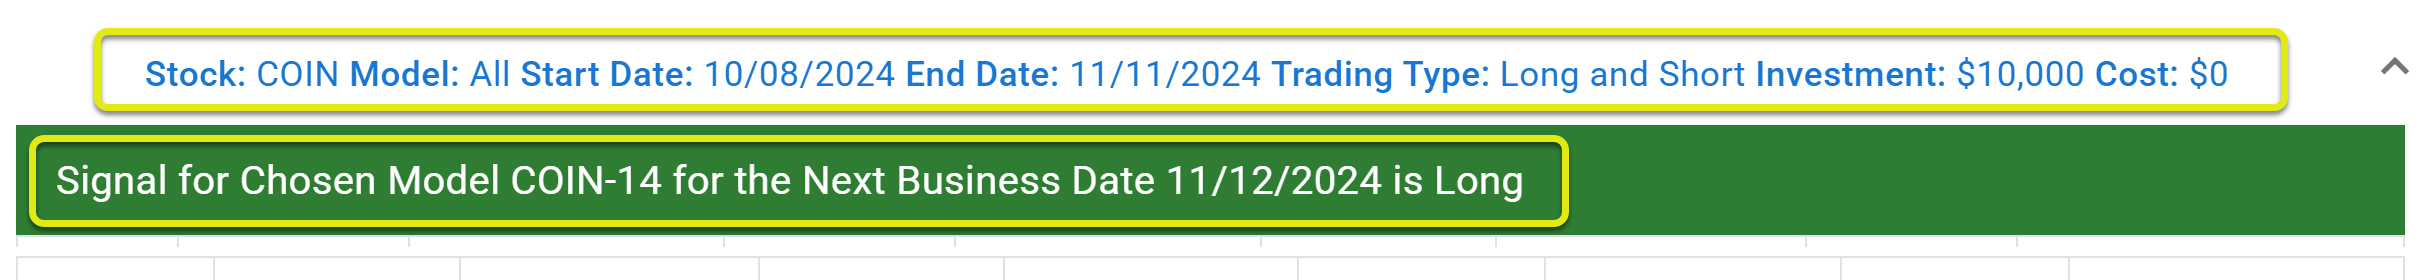
- Your chosen model's next day trade signal
- Your stock’s ticker symbol
- Your chosen model's model #
- Your trade signal’s next day trade date
Plus Each detail highlighted in the trade signal bar to help make sure there are no mistakes and no accidental trades.
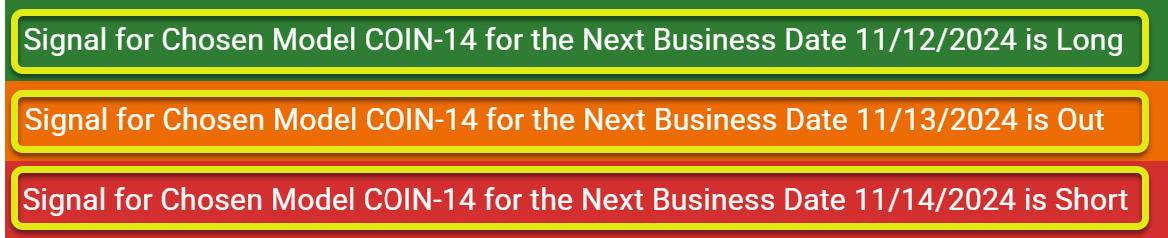
Clear & Simple Trade Signals
Freedom's trade signals are incredibly clear and simple. With each model's trade signal for tomorrow displayed in that impossible to miss, brightly colored "Chosen Model Next Day Trade Signal" bar - that stretches across your entire screen.
Nothing complicated or confusing - and no math required either:
Buy, Sell, or Get Out
Just visualize traffic signal lights: "Go, Stop, & Caution":


Proprietary Trading Models
Proprietary Trading Models
Right beneath the "All Algorithms Summary" box is the "All Models Summary" table.
Which displays a more detailed, more specific summary of results for all 16 Freedomtrading model results created by pairing Freedom's 16 proprietary trading algorithms with your stock.
The StockAnalyzer's "All Models Trade Summary" table -
all 16 Freedom models and their proprietary second-level trade metrics
A trading model is simply Freedom's unique name/label used to easily identify the 16 different "model results" created by combining your stock's ticker symbol with each one of Freedom's 16 proprietary trading algorithms. Which means you'll always see results for 16 different trading models for any stock you pick.
And once you find a specific model who's "Algorithm Summary" and "Models Summary" results you really like, when you click anywhere on thay model's row of results it will launch that model's "Chosen Model Trade Details" table and "Chosen Model Next Day Trade Signal" bar - displaying Freedom's next day trade signal and other level-3 metrics for just the model you chose:
The StockAnalyzer's "Chosen Model Trade Detailss" table displays -
Freedom's proprietary third-level analytic metrics for just the model you choose
Freedom's Proprietary Trade Signals & Trade Metrics
The StockAnalyzer's "Chosen Model Trade Details" table and "Chosen Model Next Day Trade Signal" bar highlight very detailed trade results and metrics for just the model you pick - and includes details that focus on how often and how profitably you could have traded your stock throughout your analysis period:
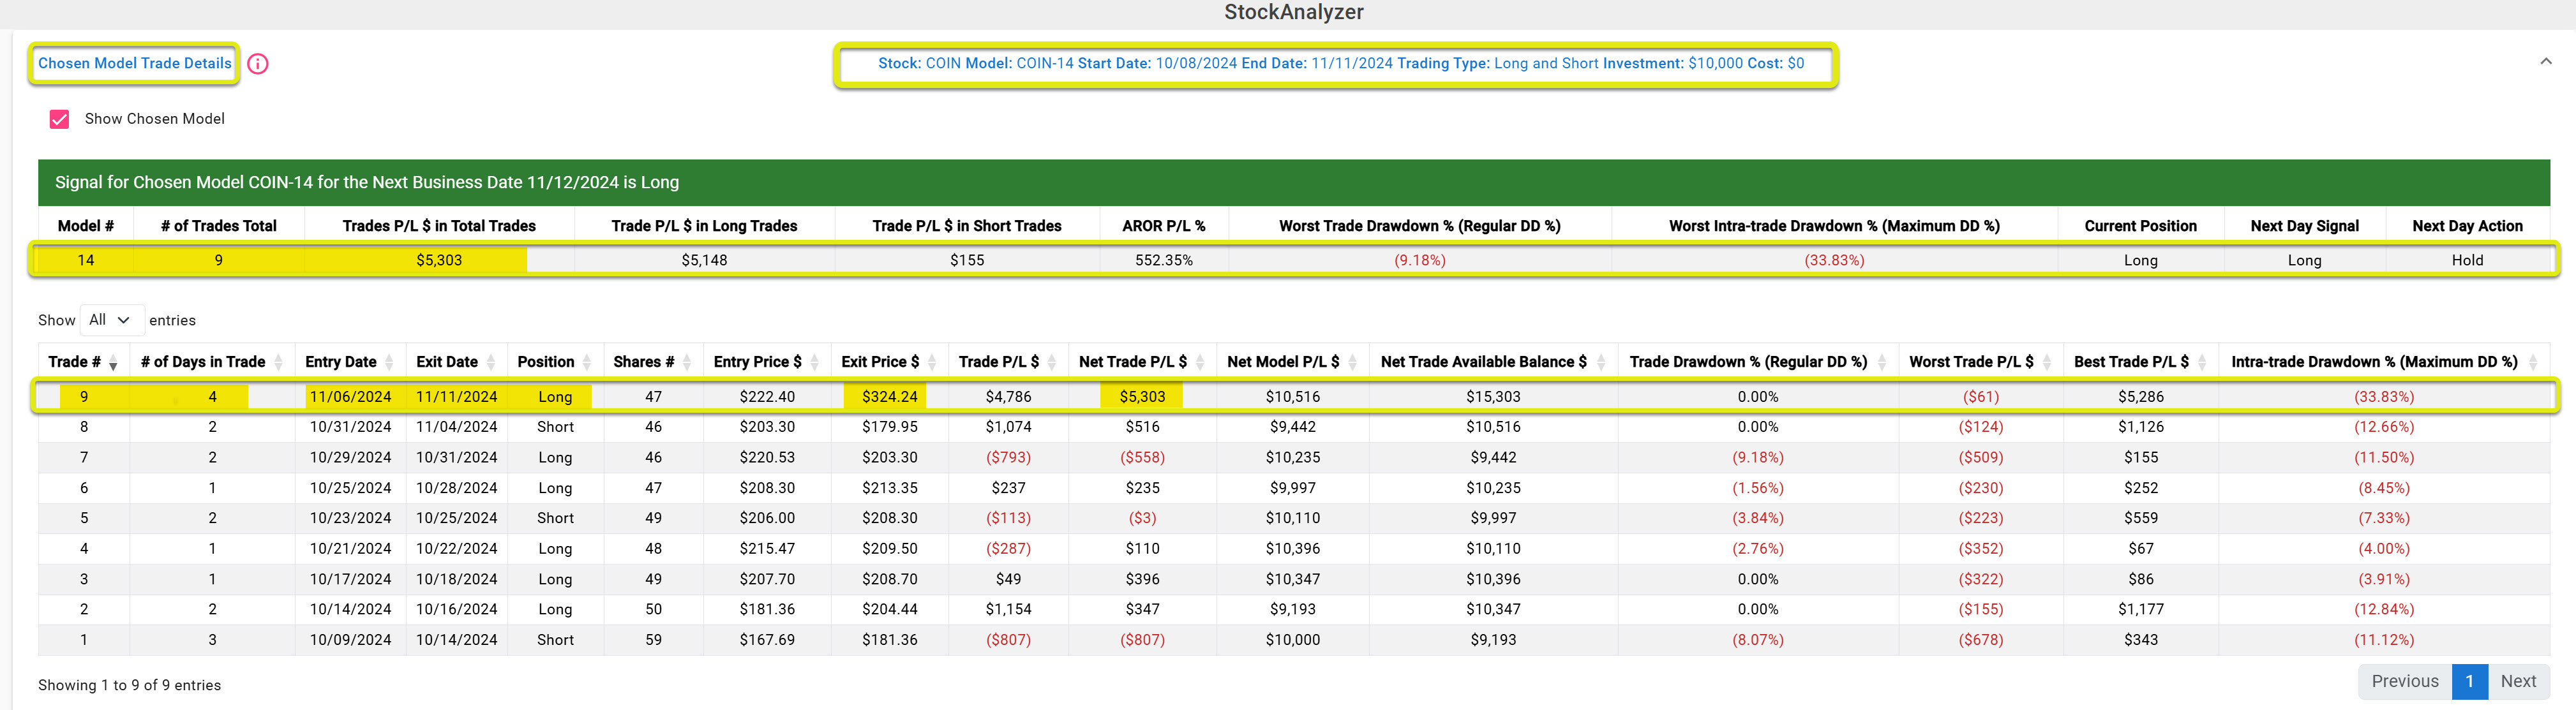
The StockAnalyzer's "Chosen Model Trade Details" table
& "Chosen Model Next Day Trade Signal" bar -
Freedom's proprietary third-level metrics - trade length, entry & exit dates, trade prices, & P/L results
The chosen model table highlights very detailed trade results and metrics for just the model you picked - focused on how often and how profitably you could have traded your stock throughout your analysis period.
The "Chosen Model Trade Details" table is filled with a very wide and deep collection of analytic data and metrics broken down trade-by-trade. It's customized trade results and details include:

The StockAnalyzer's "Chosen Model Next Day Trade Signal" bar-
Freedom's next-day trade signal, trade date, ticker symbol, & model # of your chosen model
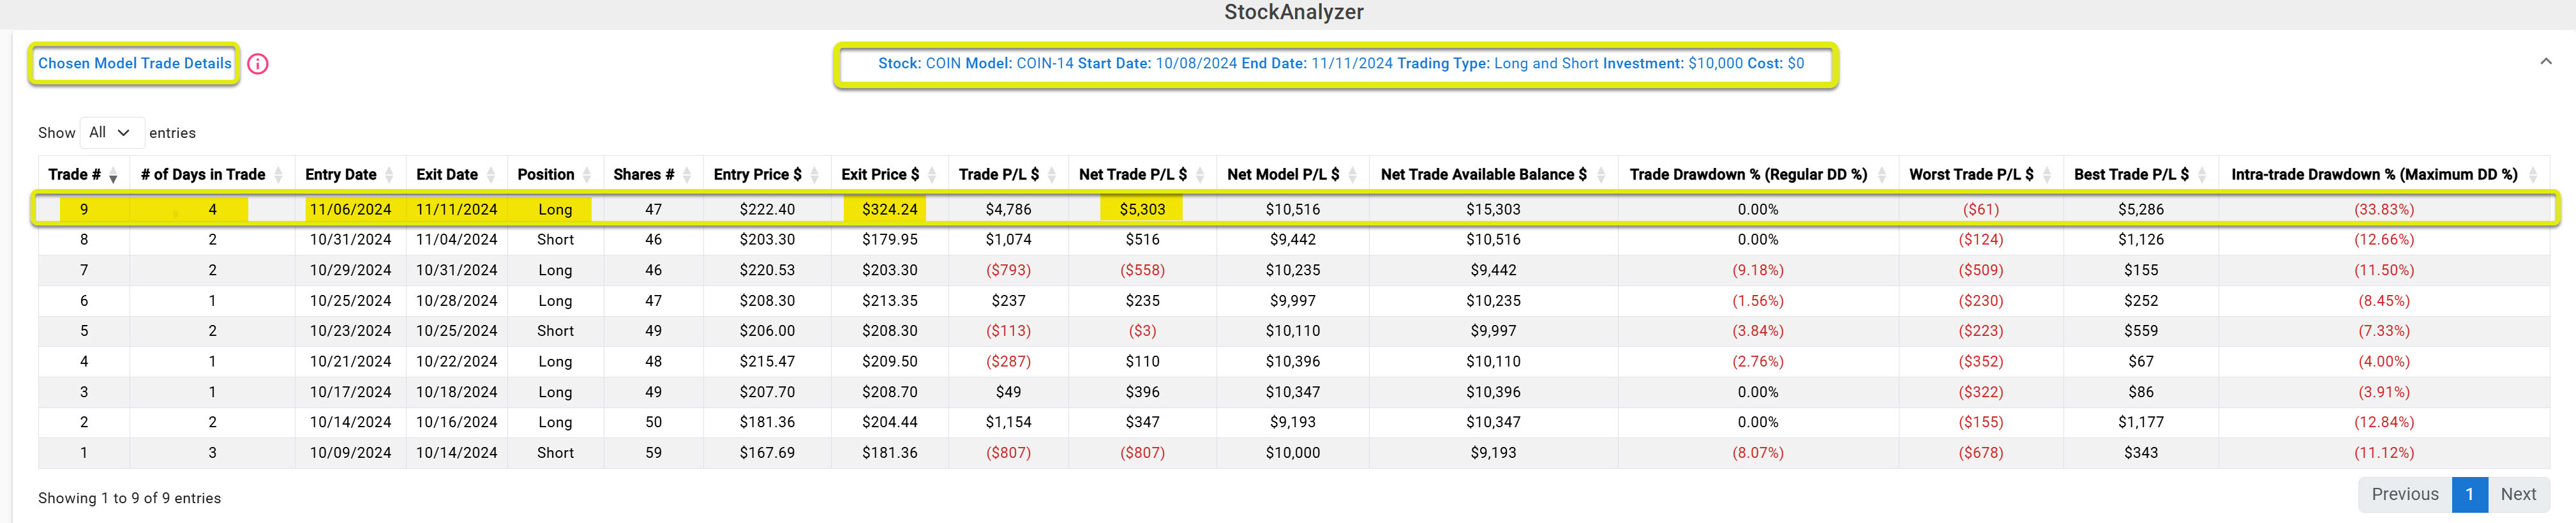
The StockAnalyzer's "Chosen Model Trade Details" table-
Freedom's chosen model's trade length, entry & exit dates, trade prices, & P/L
- Realistic "P/L $" values - beginning with your original "Investment" amount in its first trade
- The "# of Days" in each trade
- The "Entry" and "Exit" dates of each trade
- The "Entry" and "Exit" prices for each trade
- The "# of Shares" traded in each trade
- Your model's "Total P/L" return after reinvesting its "Net Trade Available" balance from one trade in your next one
Just above the "Chosen Model Trade Details" table, you'll see the "Chosen Model Trade Signal" bar - with all your next day trade signal details - in an impossible to miss, brightly colored signal bar stretching across your entire screen:
The StockAnalyzer's "Chosen Model Next Day Trade Signal" bar-
your chosen model's stock symbol, algorithm #, next day trade signal, & trade date
The next day trade signal bar contains:
- Your stock’s ticker symbol
- The Freedom model number you chose to analyze with your stock
- Your model's latest trade signal
- And the exact trade date for your model's next trade
It couldn't be cleaer - and it couldn't be simpler.
Analyzing Your Stocks - The Same Way Every Time
To summarize, after you've picked your stock and chosen your model, below are the analytical steps that you've accomplished so far:
- With a single click of the "Analyze" button you checked all of your stock's first-level trade metrics in the "All Algorithms Summary" table
- Cursoring down a little you've see your stock's "All Models Summary" table - displaying all 16 of your stock's Freedom's models' more detailed, second level trade metrics
- You've clicked on a single "chosen model" row in the "All Models Summary" table and launched the "Chosen Model Trade Details" table and the the "Chosen Model Next Trade Signal" bar This displayed your chosen model's third-level metrics: and you've reviewed its trade details, trade results, trade-by-trade metrics - and most importantly - its trade signal for tomorrow
Once you feel you've identified "the best model" for your stock, you've reviewed your model's most important trade metrics:
- You've compared all 16 proprietary trading models results for the stock you picked in the analysis period you selected
- You've chosen one specific model for your stock that you want to analyze further
- You've seen how well your chosen model's trading patterns and trade results performed during your analysis period
- You've estimated what your model's trade behaviour and future profit potential could be
- And you've identified and understood your stock and model's specific risk metrics during your analysis period
Following this 5-minute step-by-step process to analyze any stock and model will let you quickly "choose or refuse" which stocks and models to dig deeper into.
Then, armed with all your proprietary knowledge for whichever stocks and models you want, and with your chosen model's next day trade signal for tomorrow in hand by 8:00 PM EST the evening before you need to make your trade, next, you just need to place your thoroughly analyzed trade with your broker to be filled at the open of the next trading day - any time before the markets reopen.
Which means completing any stock or model's analysis is only a few clicks and a few minutes away.
Really – Freedom really is this simple.
Freedom's April 25' Portfolio Results
Freedom up +18.86% in April 25'
Freedom up +18.86% - Indexes Struggle
In April, the DOW JONES 30 and S&P 500 fell into correction territory, while the NASDAQ COMPOSITE dipped into bear market territory. Then they all spent the rest of the month trying to claw their way back out of the holes they'd dug. Only the NASDAQ COMPOSITE got out of its hole and finished slightly up.
Not Freedom. It's April portfolio started up and ended way up. Closing up at its high for the month: an amazing + 18.86%.
- Freedom: + 18.86%
- DOW JONES 30: - 3.20%
- S&P 500: - 0.80%
- NASDAQ COMPOSITE: + 0.90%
So Freedom overwhelmingly beat all the major indexes - easily.
And the reason it did is really simple:the indexes and their stocks always have to be Long.
Freedom "Goes Long" too - but it also takes advantage of "Going Short" in some of its trades, and even "Gets Out" of some other trades - to protect your profits and your trading capital.
How Freedom Beats the Indexes
Freedom's April model portfolio took advantage of profiting on its Short signals - making 10 Short trades from of 21 total trades - and the generated a profit of + 8.86%. Then, it turbo-charged its results with 11 Long trades generating an even better profit of + 10.00%.
And that’s how Freedom ended the month of April: on a 7-day Long trade run, on the way to that gain of + 18.86%, while the market indexes all recovered from their low points in that last week - but still fell further behind.
Freedom's Model Portfolio Trade P/L Results and Details
Below is Freedom's "PortfolioAnalyzer" module's April 25' model portfolio's trade results and details. And we can break them down into its specific trades and how they combined together to produce April's amazing results:
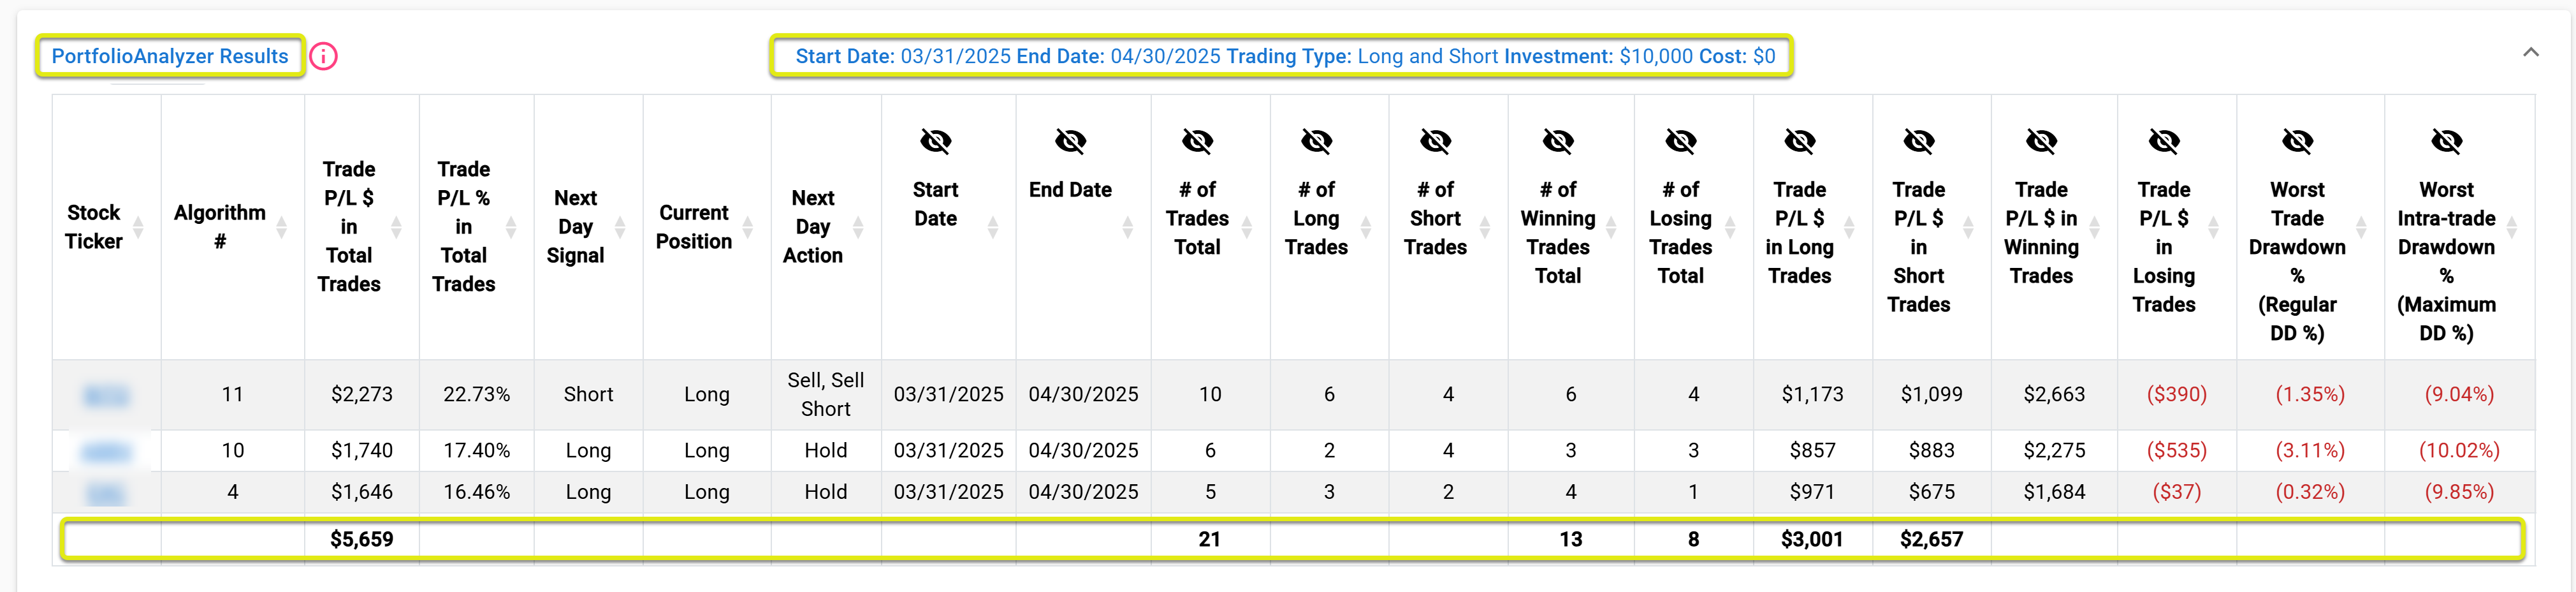
Freedom's Model Portfolio Trade Metric Details
First - we can look at its different trade types and their results:
- Total: 21
- Longs: 11 or 52%
- Shorts: 10 or 48%
- Winners: 13 or 62%
- Losers: 8 or 38%
Freedom's Factors For Success
Freedom's model portfolio made great profits in April - on its Long trades (+10.00%), and made almost as great profits on its Short trades (+8.86).
It also optimized its returns by staying longer in its Winning trades (3.06 days on average) and by cutting off its Losing trades quickly (avg. 1.08 days).
At the core of Freedom's approach to success is:
- Trade Long, Short, or Out with Freedom's daily signals
- Let your Winners run
- Cut off your Losers quickly
- And flip your Losers when you get that signal to try to recover those losses in your next, opposite trade
And this is exactly how Freedom was designed to work:
- Make money with its Long signals when your stocks go up
- Make money with its Short signals when your stocks go down
- Protect your money with its Out signals when your stocks go down
See? Freedom really is this simple... up + 18.86%
Freedom's Daily Dominant Trade Signal
April's Dominant Trade Signal - 57% Long
April's Trade Results
April was a volatile month for all of the major U.S. market indexes. The first half started off horribly, then the second half struggled to recover. And in the end, only the NASDAQ COMPOSITE closed up for the month.
But Freedom's results were different.
It made money when stocks went up and when stocks went down. So its model portfolio started strong, finished stronger, and ended the month up +18.86% for April.
Daily Trade Signals
Freedom's daily trade signals often change from "Long" to "Short" or "Long" to "Out" and then the reverse because individual stocks trading patterns can change daily - sometimes overnight:
So that Freedom's daily trade signals for each one of your stock's sixteen models can make you daily profits, while also protecting your trading capital whenever your stock goes down or drifts sideways.
Freedom's Daily Dominant Trade Signal
Each evening, Freedom generates new trade signals for tomorrow for all 11,000 stocks that trade daily on the U.S. stock exchanges. Then, it computes tomorrow's "Long/Short/Out" combined trade signal mix for all 11,oo stocks so it can identify tomorrows's "Daily Dominant Trade Signal".
It then inserts those Long/Short/Out" trade signal metrics into the "AlgorithmAnalyzer" module's Daily Trade Signal" table, and also highlights each day’s daily dominant trade signal"
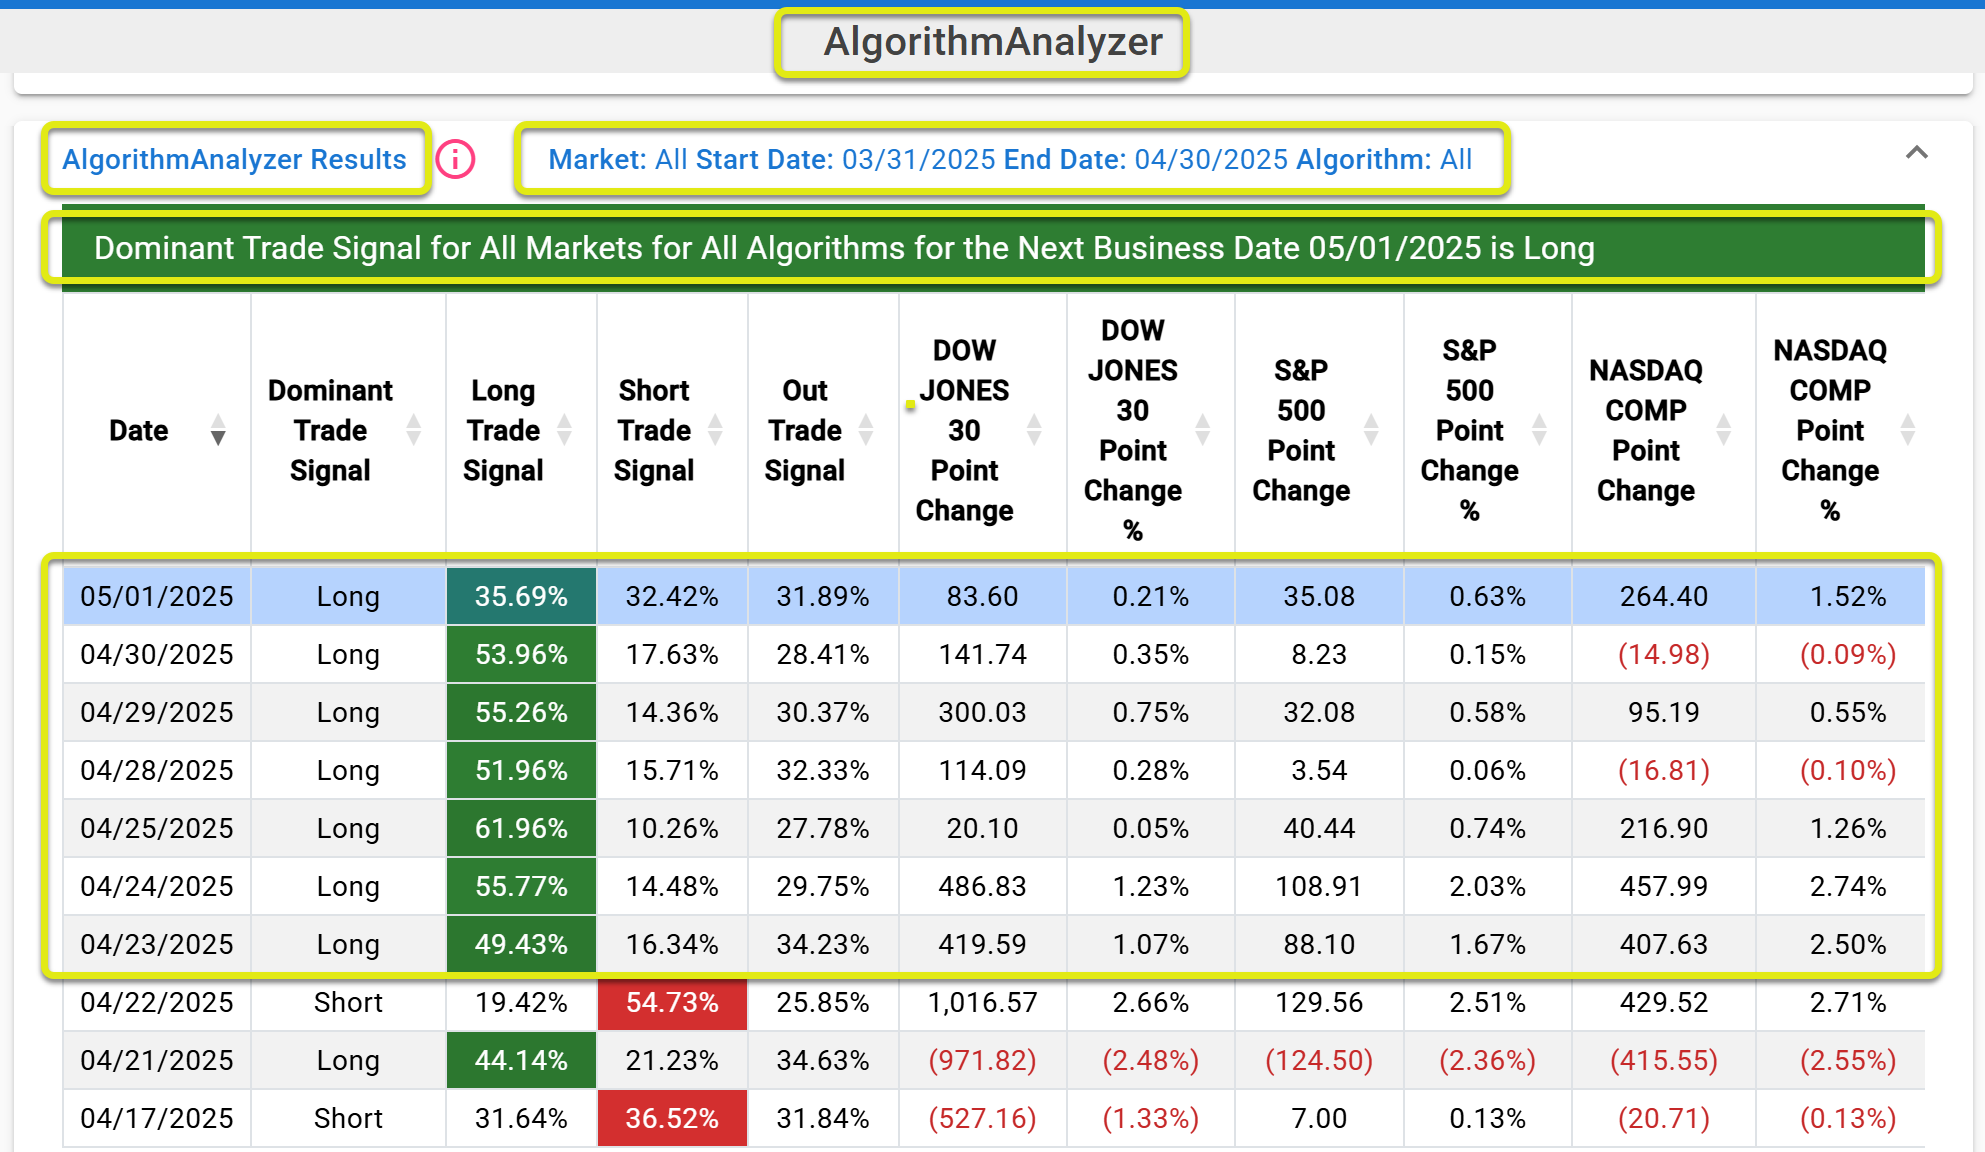
Freedom's AlgorithmAnalyzer
Freedom's "AlgorithmAnalyzer" table displays the daily signal mix for all 11,000 stocks that trade daily on the U.S. exchanges. But most importantly, the table is updated nightly, at the end of each trading day, with Freedom's latest daily proprietary model metrics.
The left side of the table has five columns: containing the daily signal mix for whatever date range you choose - "Long, Short, or Out", including:
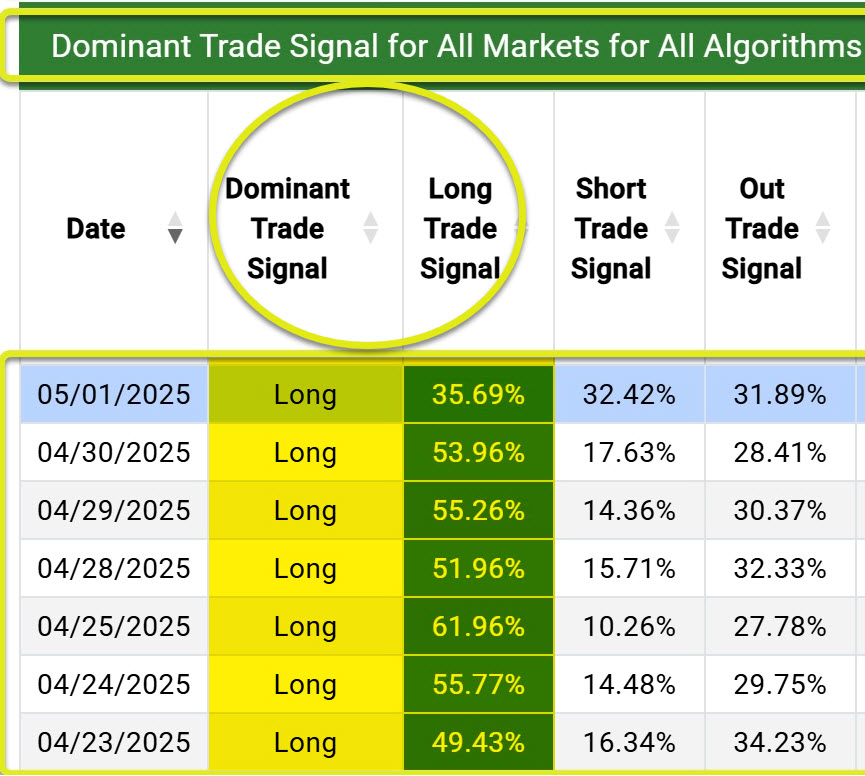
- The "Trade Date"
- That day's "Dominant Trade Signal"
- That day's % of "Long Trade Signals"
- That day's % of "Short Trade Signals"
- That day's % of "Out Trade Signals"
While on the right side of the table we have six columns - containing the trade results for each major U.S index on each date, specifically:
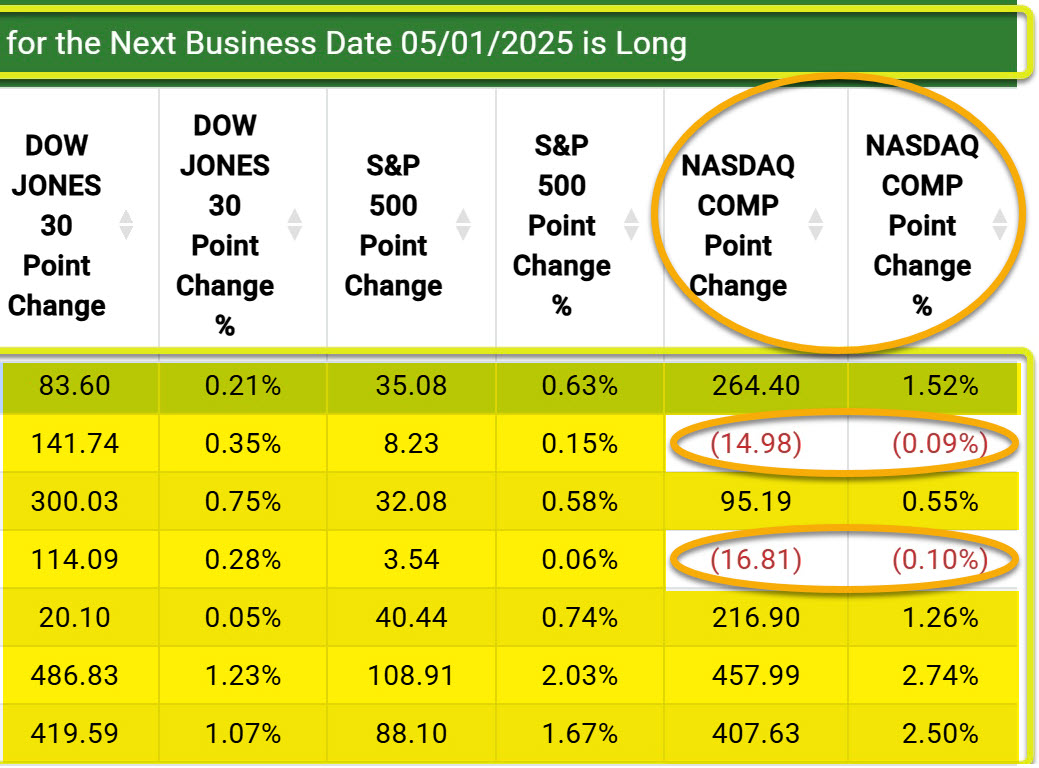
- The daily point and % changes for the DOW JONES 30
- The same daily results for the S&P 500
- And the same daily trade results for the NASDAQ COMPOSITE
And when you put the two sides together, we can see a clear, positive correlation between Freedom's daily trade signal mix and "Dominant Trade Signal" for each date you choose and the market index results on the same date:
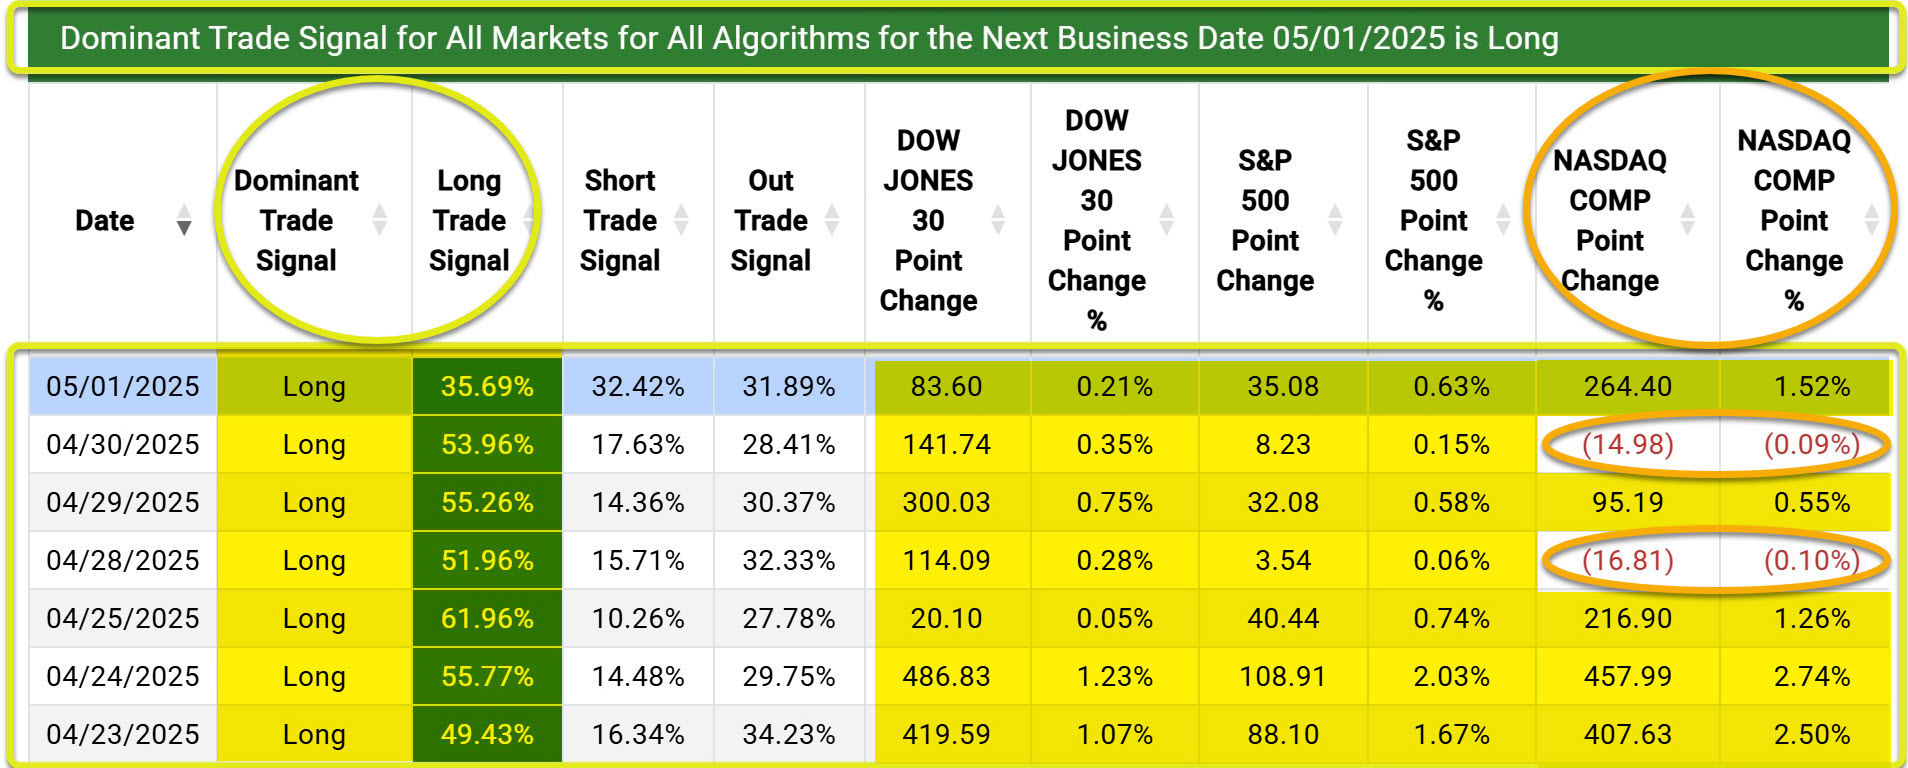
And as we can see in our example, the last seven days of May, while Freedom's "Daily Dominant Trade Signal" was "Long" for seven days in a row.
In the same period, the DOW JONES 30 and the S&P 500 went up each day - while only the NASDAQ COMPOSITE ever went down. And when it did, on 04/28/2025 and 04/30/2025, it only lost 32 points or -0.19%.
And the index net gains during those seven days in a row were great:
- DOW JONES 30: +1,566 points or +3.94%
- S&P 500: +316 points or +5.86%
- NASDAQ COMPOSITE: +1,379 or +8.19%
And with Freedom being net Long for all seven days, the "typical" subscriber who was also net Long throughout that entire date range would have done very, very well.
So the "AlgorithmAnalyzer" table is another proprietary tool within Freedom's analytical toolbox. Because it's overall daily trade signal mix and "Daily Dominant Trade Signal" can also be used as a predictive indicator for how the indexes will trade the next day.
And its available to subscibers by 8:00 PM EST each evening - more than 12 hours before the stock market reopens:
- The correlation between the two sides of the "AlgorithmAnalyzer" table show us that it's "Daily Dominant Trade Signal" is correct about how the indexes will trade the next day more than 65% of the time
- And on those days the "AlgorithmAnalyzer" is correct - the indexes move significantly - both up and down
For example, the daily signal mix on 04/23/2025 was predominantly Long: 49.43% Long, 16.34% Short, and 34.23% Out.
And on that date, the major indexes all went up: +419.59 or +1.07% for the DJ 30, +88.10 or +1.67% for the S&P 500, and +407.63 or + 2.50% for the NASDAQ COMP:
- The 49.43% of Freedom subscribers who were Long would’ve likely seen their stock's prices go up and so would've made some nice profits
- While the 16.34% of subscribers who were Short might've seen some losses - but if they did, they also should’ve seen their Long profitable stocks more than make up for any "Short" unprofitable stock losses
- And the 34.23% of subscribers who were Out would've probably missed the overall market updraft - but whether their stocks' prices went up or down they'd have had no risk in their Out position stocks losing money either
But if instead stock prices and the major indexes were all to have gone down signally that day:
- The 49.43% of Freedom subscriber's positions that were Long that day would’ve likely seen losses if their Long trade positions - like the major indexes and their constituents - went down
- While the 16.34% of subscriber's positions who were Short that day would’ve likely seen some profits if their "Short" stocks - like the major indexes - went down
- While the 34.23% of subscribers who were Out that day would’ve missed the overall market downdraft - but whether their stocks' prices went up or down they'd have had no risk of losing money
And each row of the "AlgorithmAanalyzer's" history table contains the same ten columns - making it easy to scan through and look for those co-related results.
With one exception: the top row of index results on the right side.In our example, on 04/23/2025, everybody would've seen "Unavailable" across all six index results columns. Because trading on that date hadn't finished yet - or hadn't even started.
- Would have had those proprietary trade signal metrics for 04/23 25 by 8:00 PM EST on 04/22/25
- And they'd also have had all its signal metrics more than 12 hours before the markets re-opened for the next trading day
- But that top row of market index results aren't published until 8:00 P.M. EST on 04/24/25 - when
- But that date's index results will display "Unavailable" until trading on 04/24/25 is completed and
But non-subscribers wouldn't know Freedom's "Daily Dominant Trade Signal", or its "Long, Short, Out" trade signal mix on 04/23/2025, - or on any day for that matter.
But not Freedom's subscribers - they'd have known their next day trade signals for the stocks they picked, the "Daily Dominant Trade Signal", and its Long/ Short/Out trade signal mix since the evening before, on 04/23/25 - by 8:00 PM EST - more than 12 hours before the markets would even re-open on 04/24/25.
And they could also use the most current signal metrics from the "AlgorithmAanalyzer's" history table as another proprietary edge. Because they'd already know what Freedom expects the overall direction of the major markets to be the next trading day.
They could use that day's signal mix and dominant signal metrics to anticipate that next day's overall market direction - and potentially use it to support their individual stocks' trade decisions the next day.
They could even use the "AlgorithmAnalyzer's" history table as a back-testing tool - to look back and see just how well Freedom has been predicting the next day's broader market direction.
If we look at the complete April "AlgorithmAnalyzer" snapshot, we can see that Freedom's dominant trade signal was Long 57% of the month. And it's dominant daily trade signal was correct about the indexes next day direction 51% of the time throughout the entire month of April.
And if we go back to the partial April screenshots above we can see that beginning on 04/24/2025, Freedom's dominant trade signal was Long seven days in a row - right through the end of the month.
We can also see these Long signal metrics were very, very good at predicting the next day's index results. And, that all of the indexes were very, very positive over those seven days.
So the "typical" Freedom subscriber probably did very, very well too... as the month of April drew to a close.
Really - Freedom really is this simple...
Freedom's Simplicity
Analyze any stock, anytime, anywhere - with no charts, no graphs, no spreadsheets - and no math either
Profitable
Easily discover individual stocks that have made weekly and monthly profits of between 10 & 100 percent from within all of Freedom's thousands of new trade signals every day -
and in just aa few minutes each evening you get your stocks' proprietary, next day trade signals for tomorrow's trading - trade signals that have generated amazinging profits every single day
Freedom really is this simple!
Easy To Use
You just log into Freedom's once a day - each evening, after 8:00 PM EST, once the markets are completely closed - and get your new trade signal for tomorrow for any stock you pick in just seconds -
Buy, Sell, or Get Out - more than 12 hours before the markets reopen for trading
Simple Numbers
All of the trade results, trade details, and trade signals Freedom displays ater you analyze any stock are just simple, easy-to-understand numbers and words.
With no confusing charts or graphs full of multi-colored solid, dashed, and dotted lines,
and with no huge spreadsheets - full of multiple choice functions or with endless rows and columns full of embedded mathematical formulas to struggle with
So that you just pick your stock, press the "Analyze" button, and Freedom does all the math for you and handles all the days, months, and years of seemingly endless data, and the required multi-level analysis for you
Analyze Any Stock
As long as your stock is 1 of the 11,000 stocks that trades daily on the NYSE or NASDAQ stock exchanges, you can just enter its ticker symbol in the "User Inputs" box on the main "StockAnalyzer " page, press the "Analyze" button - the only button on the screen - and in just seconds you'll see all 16 profit opportunities that Freedom's proprietary algorithms have uncovered for any stock you pick - and most importantly - your stock's next day trade signal for tomorrow
Freedom's Predictive Power
Freedom's Predictive Power & the Market Indexes
Freedom's Daily Dominant Trade Signal
Even though it's only been four months, 2025 has been another great year for Freedom so far. It's model portfolio results for April was up +18.86%, and is up +46.47 year to date.
And those aren't typos. Freedom was up +18.86% in April, and is up +46.47% YTD - in just 4 months.
And it's outperformed all the major indexes during the the same time period. First, in April, the DOW JONES 30 and S&P 500 fell so far they fell into correction territory, while the NASDAQ COMPOSITE fell so far it actually dipped into bear market territory - before all three indexes recovered to finish mostly flat for the month.
- Freedom:Up +18.86%
- DOW JONES 30: Down -3.20%
- S&P 500: Down -0.80%
- NASDAQ COMP: Up +0.90%
The Freedom Difference
What makes such a huge difference? Simple - the indexes always have to be Long. And that's exactly how Freedom is designed to work:
- Make you money with Long signals when stocks go up
- Make you money with Short signals when stocks go down
- Protect your money with Out signals when stocks stop following their historical trading patterns
Freedom's Proprietary Algorithms Nightly AI Processing
Each evening Freedom generates tens of thousands of new trade signals for tomorrow for all 11,000-plus stocks that trade daily on the U.S. stock exchanges.
Then, it computes tomorrow's dominant trade signal and the next day's "Long/Short/Out" trade signal mix for all 11,000-plus stocks..
It then inserts that next trading day's date, it's dominant trade signal, plus it's Long/Short/Out trade signal mix for that next trading day in the "AlgorithmAnalyzer" module's daily trade signal table:
Freedom's AlgorithmAnalyzer Module
Displayed below are the last 10 days of April's trade signal data followed by that next trading day's major stock index results from the "AlgorithmAnalyzer" module.
And you can easily see how successful Freedom's daily dominant trade signal was each evening at 8:00 PM EST at predicting the next trading day's overall market direction.
Freedom's Daily Dominant Trade Signal
The "AlgorithmAnalyzer" module above first 5 columns contain each trading day's date and each trading day's dominant trade signal - either Long, Short, or Out.
Those Freedom daily dominant trade signal metrics are generated and published by 8:00 PM EST at the end of each trading day) - the evening before that next trading day even opens for trading again.
The table's remaining 6 columns display the major market indexes next day trading results. Results that can't be updated in the table until trading is completely finished on that next trading day.
And those last seven days of April's Freedom's dominant trade signal was Long for seven days in a row. While the index results on each of those trading days were all up (with only the NASDAQ COMPOSITE having two slight down days). With combined total gains over those seven days of between hundreds of points for the S&P 500 and thousands of points for the DOW JONES 30 and NASDAQ COMPOSITE.
Freedom's AlgorithmAnalyzer & The Indexes
Those last seven trading days in April saw all of the indexes recover - as they all had positive results of between just over 3.50% to just less than 7.00%:
So we can see how well Freedom's daily dominant trade signals are corelated to the major indexes results the following day.
But subscribers and non-subscribers alike still all have to wait - until 8:00 PM EST - when Freedom publishes that latest date's major index results while also computing and publishing the next trading day's dominant trade signal based on Freedom's next day Long/Short/Out trade signal mix.
Freedom's AlgorithmAnalyzer Module In Real-Time
To see how much Freedom's daily dominant trade signals are currently corelated to the major indexes, below is a temporary, dynamic link to the proprietary "AlgorithmAnalyzer" module's most recent data table - displaying the latest 10 day period's daily dominant trade signals.
This real-time example of the proprietary power of Freedom's trading algorithms and quantitative analytic metrics - proprietary power you and our subscriber's can use every day to beat your trading competition.
And only Freedom's subscribers can see that signal data the day before those trade signals are meant to be executed. And that proprietary signal data can only be found on www.tradersfreedom.com.
Yet another example that Freedom really is this simple...
The Freedom Blog
Our Monthly Blog Posts
Stay up to date with our Freedom Blog posts while you trade your Freedom models to make sure you are making the smartest most profitable trades you can
Freedom's AlgorithmAnalyzer: Freedom’s Daily Signal Engine
Aug 30, 2025 — by Traders Freedom
A quick tour of the intelligence layer that powers Freedom’s daily trade signals.
GME Proof-of-Concept: StockAnalyzer in Action
Aug 30, 2025 — by TradersFreedom.com
We re-ran Freedom’s signals using only data known as of 12/31/2020 to show how the system behaved through GME’s wild 2021 run.

Stock Trading Signals Today for Tomorrow's Trades
Mar 31, 2025 — by Lisa Moratz
Freedom Really Is This Simple